A report is read by people with less time than the person who wrote it. Most recipients will read the summary, glance at the figures, and stop.
That is not a failure of the audience — it is the brief. A well-structured report gives a skimming reader the right conclusion and gives a careful reader the evidence behind it.
Summary first, and make it a conclusion
The summary should say what happened and what it means, not what the report contains. Compare:
This report covers fulfilment performance for Q2.
with
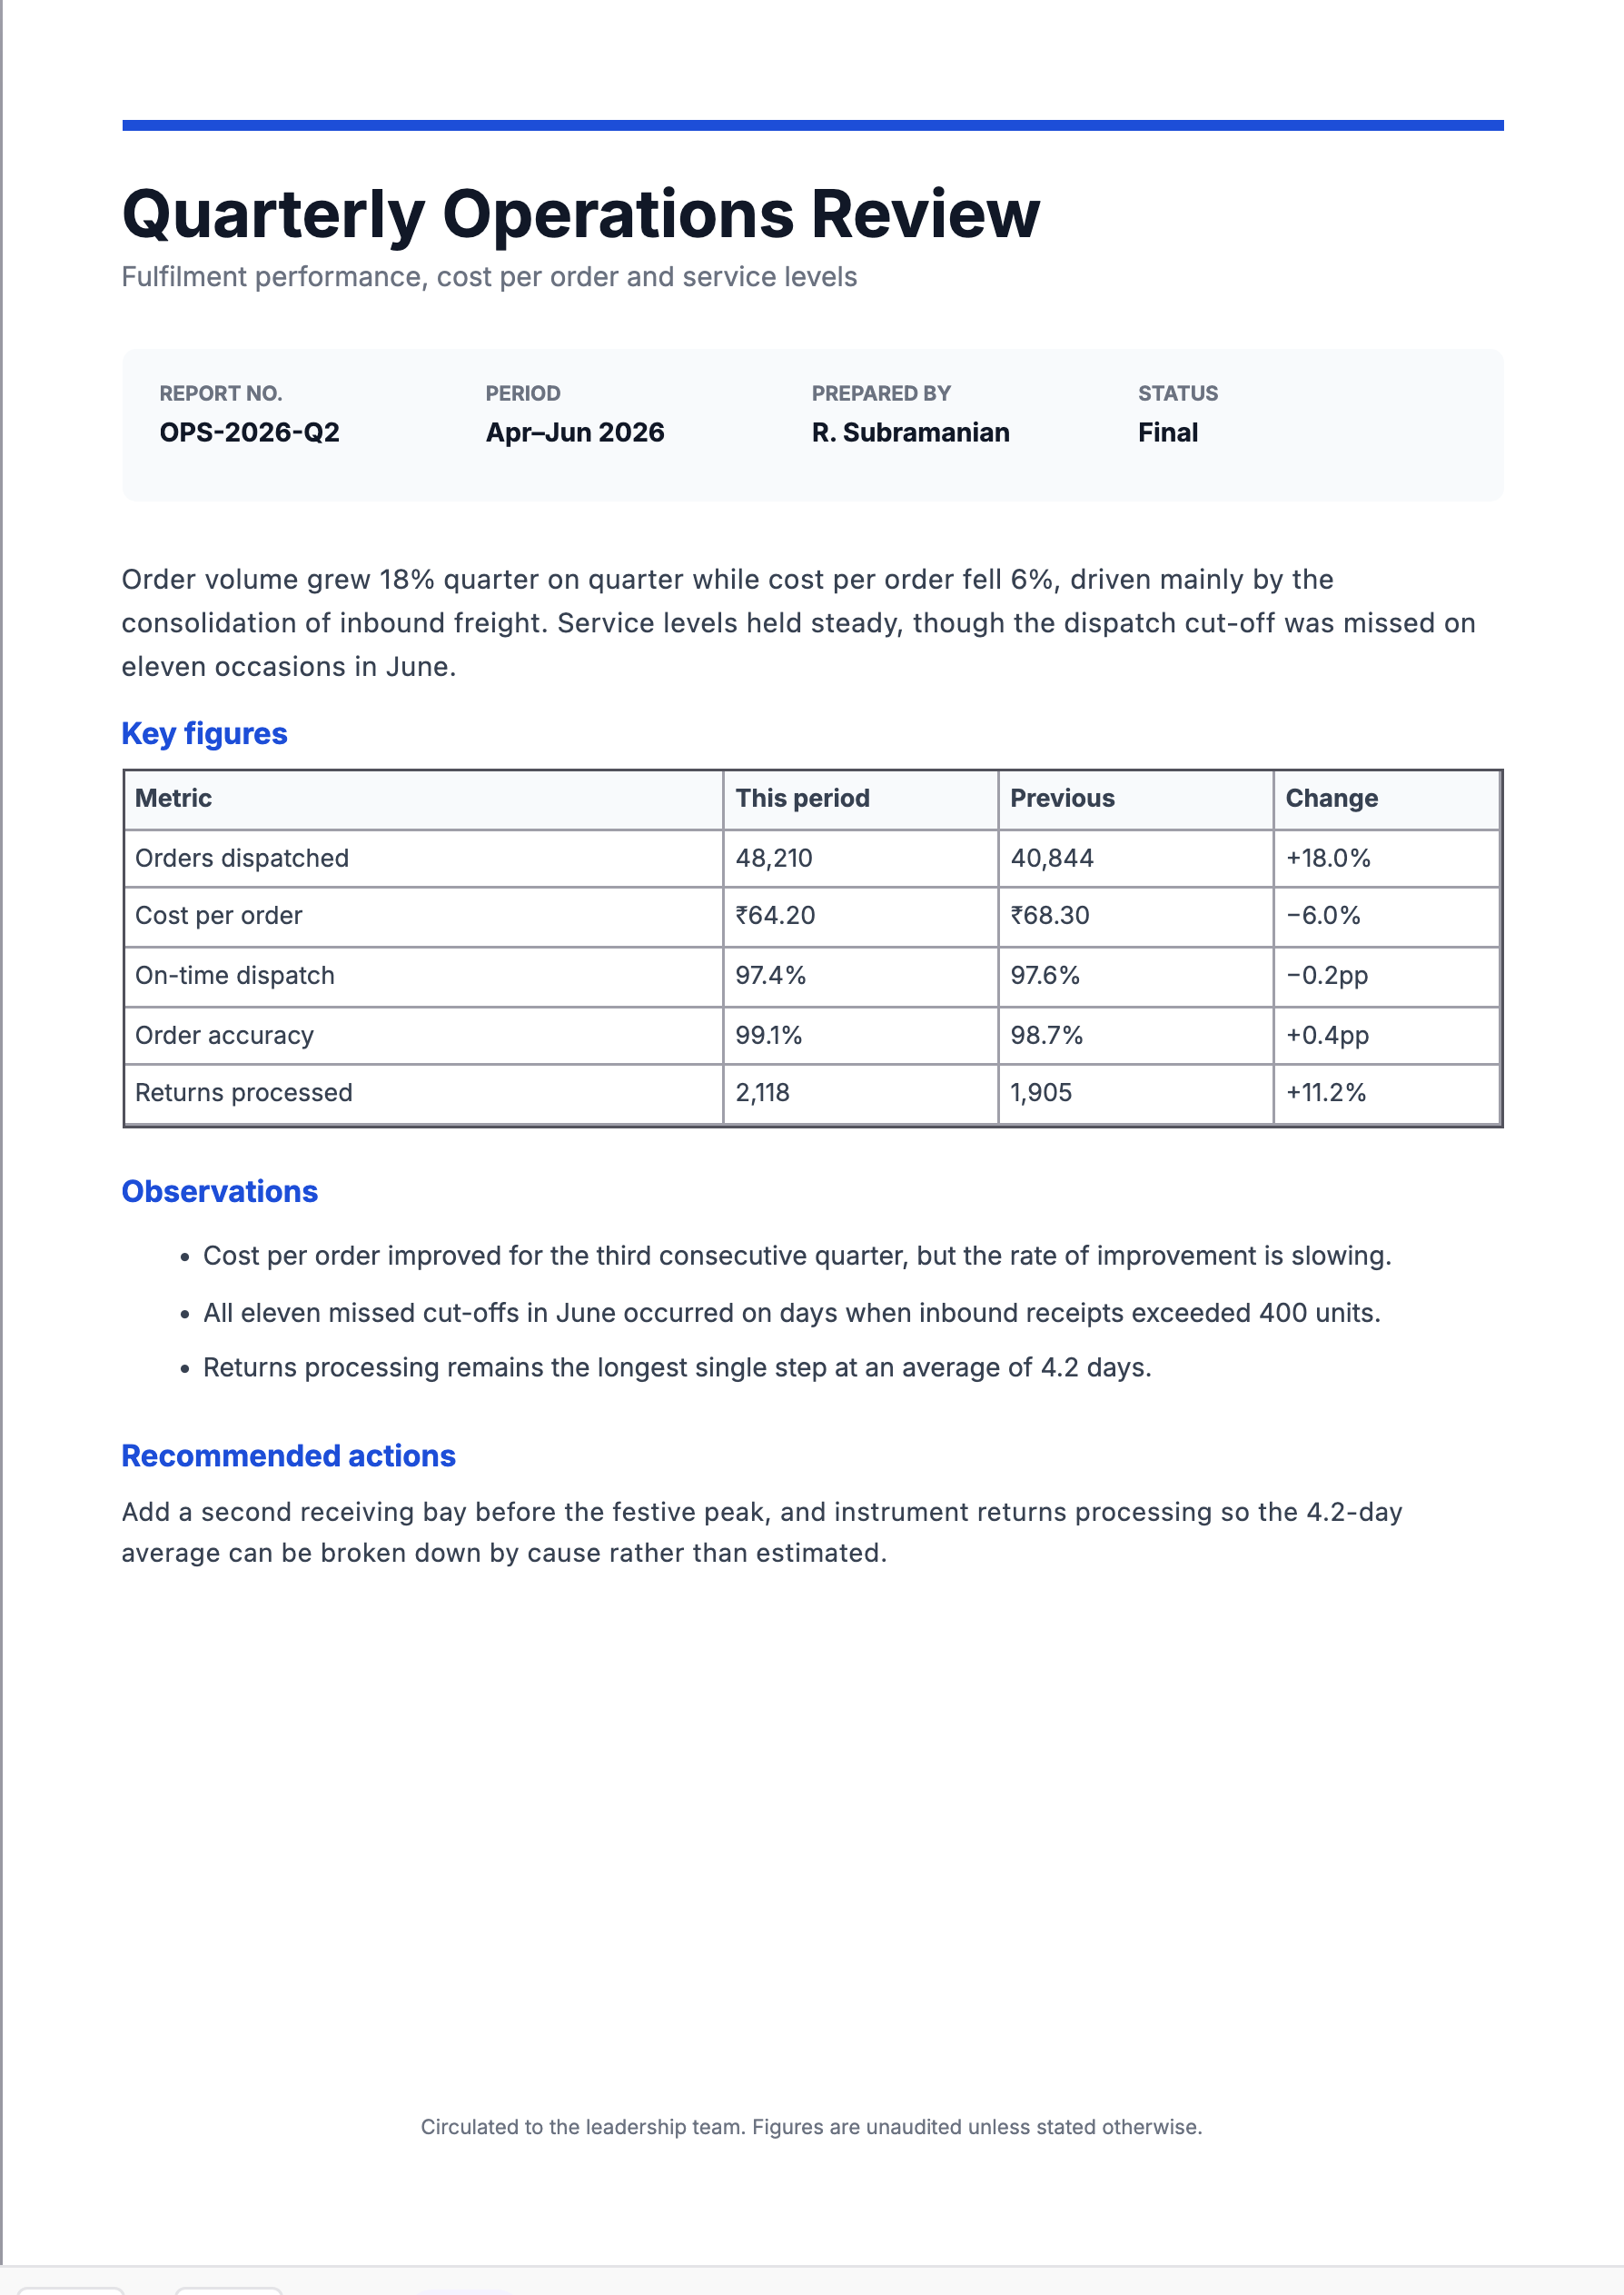
Order volume grew 18% quarter on quarter while cost per order fell 6%, driven mainly by the consolidation of inbound freight. Service levels held steady, though the dispatch cut-off was missed on eleven occasions in June.
The second is the report, compressed. Someone who reads only that has been properly informed, including about the bad part.
Always show the comparison
A number with no baseline is not information. The template's figures table has four columns — metric, this period, previous period, change — because the change column is what people actually read.
Be careful with units in that column. Percentages and percentage points are different things, and conflating them is the most common error in management reporting. If on-time dispatch went from 97.6% to 97.4%, that is −0.2 percentage points, not −0.2%. Writing "pp" makes it unambiguous.
Separate observation from recommendation
They are different claims and deserve different scrutiny.
An observation is what the data shows: "all eleven missed cut-offs in June occurred on days when inbound receipts exceeded 400 units."
A recommendation is a judgement about what to do: "add a second receiving bay before the festive peak."
Blending them lets a weak recommendation ride on a strong observation. Keeping them apart lets a reader accept the finding and argue about the action, which is usually the productive conversation.
Say what you do not know
The strongest line in the sample report is the one admitting a limit: returns processing averages 4.2 days, and the recommendation is to instrument it so the average can be broken down by cause rather than estimated.
Reports that project total confidence get trusted less over time, because eventually one of the confident claims turns out to be wrong. Naming the uncertainty is what makes the rest credible.
Status and figures provenance
The template's header carries a status field — draft, final, revised. Use it. A draft circulating without that label gets quoted as final, and the corrections never catch up with the original.
The footer notes that figures are unaudited unless stated. That is worth keeping for any internal report containing financial numbers.
Recurring reports should be generated
A quarterly report has the same structure every time and different data. Writing the narrative is the part that needs a person; assembling the figures table is not.
Generating the document from your reporting data means the numbers in the report always match the numbers in the system — which removes the most tedious review step, and the most embarrassing kind of error.